Series: Using the GT-SP Touch Panel TFT Display with Arduino
Controlling a DC Motor and Displaying Graphs Using a Slider
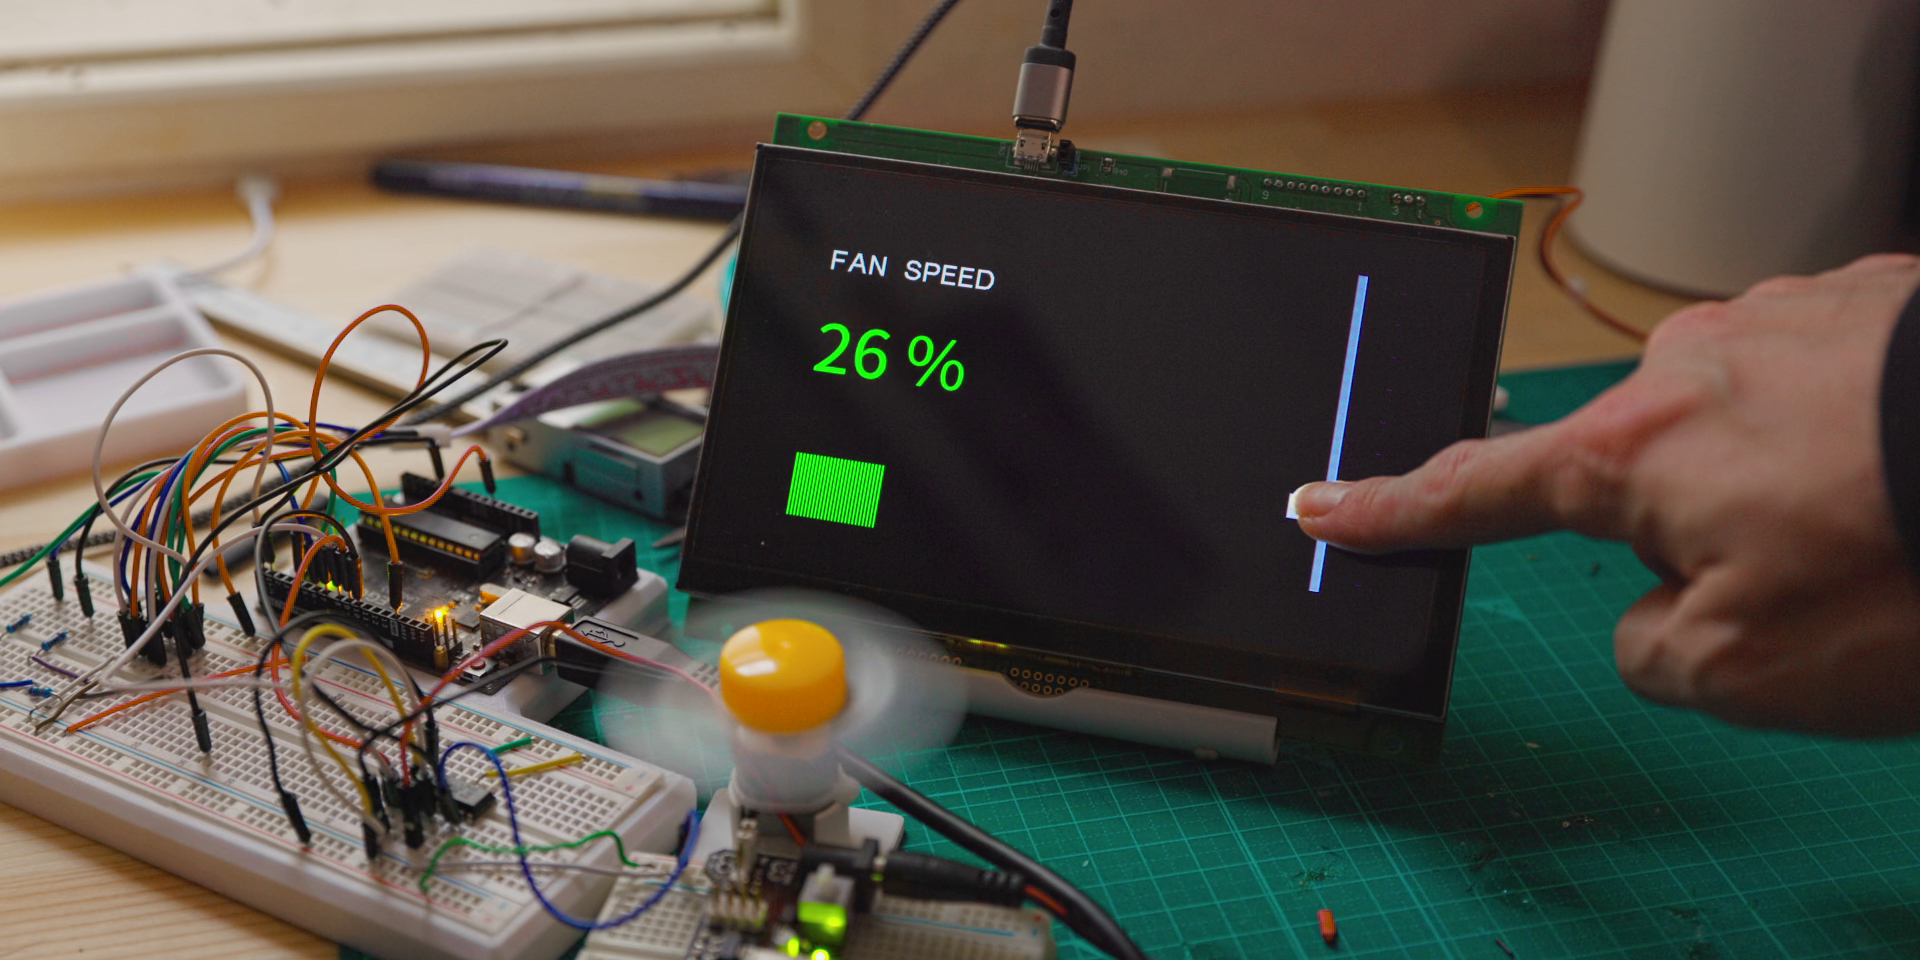
Table of Contents
DownloadDownload sample project & program (for GT Design Studio & Arduino)
Hello everyone, I’m @kissaten, a beginner in electronics. In this series, I’m explaining the process of connecting a 7-inch touch display (GT-SP series “GTWV070S3A00P”) to an Arduino and working on various projects.
In this article, we will combine the functions we have covered so far to create a system that controls the rotation speed of a DC motor using a GT-SP slider. I will explain how to link the slider operation to the motor’s movement and reflect those values on the screen using a graph and text.
Screen Layout for This Project
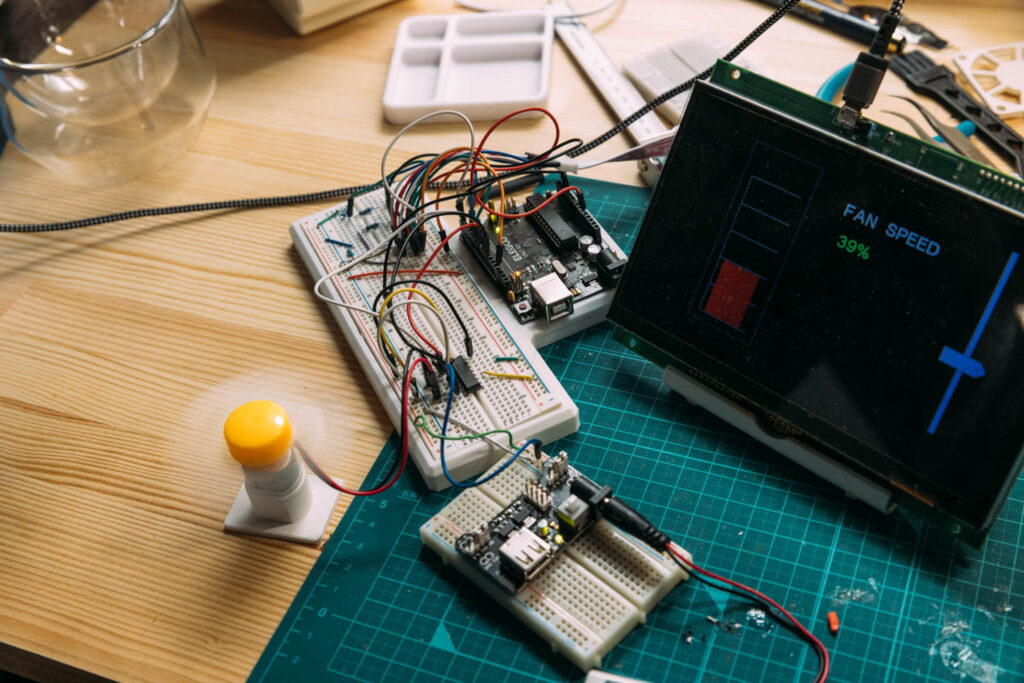
In this project, we will create the following control panel.
We will place a vertical slider on the right side of the screen, and prominently display the label “FAN SPEED” along with the current value on the left side. Additionally, a horizontal graph (BLOCK STACK) showing the motor’s output transition will be placed at the bottom of the screen.
This design allows you to see the entire control flow: operations on the screen directly translate to the movement of physical parts, and the results are fed back to the screen.
Creating the Screen in GT Design Studio
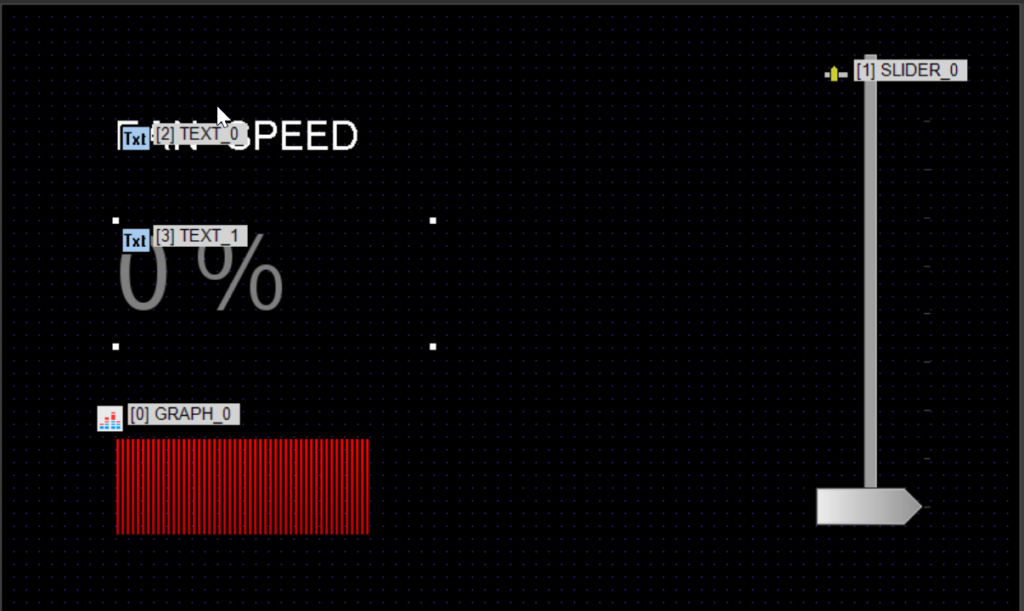
Using GT Design Studio, we will place the necessary objects for the operation screen.
- Slider object (Vertical, Setting range: 0–100)
- Graph object (BLOCK STACK, Horizontal)
- Text object (For label: “FAN SPEED”)
- Text object (For displaying the slider value)
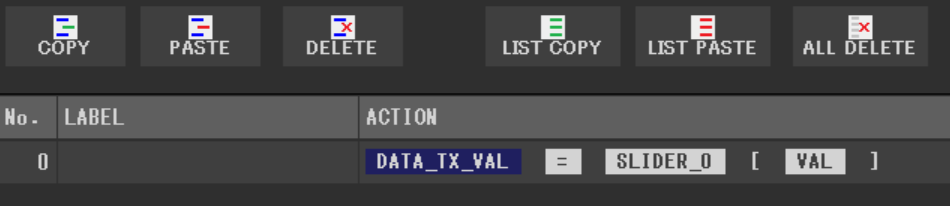
To send the value to the Arduino when the slider is operated, add “DATA_TX_VAL” to the slider’s event settings, and specify “SLIDER_0 [VAL]” as the value to send. This allows the current slider value to be sent to the Arduino. The slider value will be retrieved every second and drawn on the BLOCK STACK graph.
Furthermore, to make the status easier to grasp, we will incorporate a process in the Arduino program where the colors of the text and graph objects change automatically according to the value. By switching the color to gray, green, yellow, and red based on numerical ranges (such as stopped, low output, and high output), we can achieve an intuitive interface.
Additionally, to improve visibility, the text size of the text object displaying the numerical value is enlarged. For the graph object, we adjusted the angle and hid or removed the color of unnecessary elements like frames.
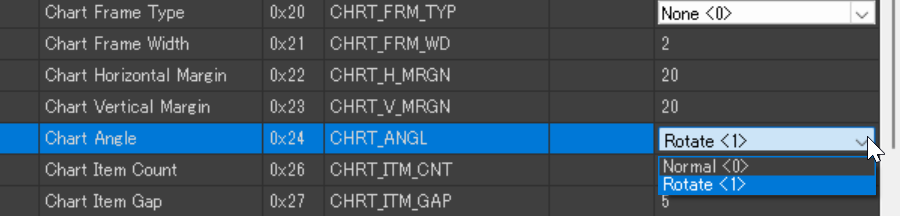
The angle of the graph object can be set by changing “Chart Angle” under “Style” to “Rotate<1>”.
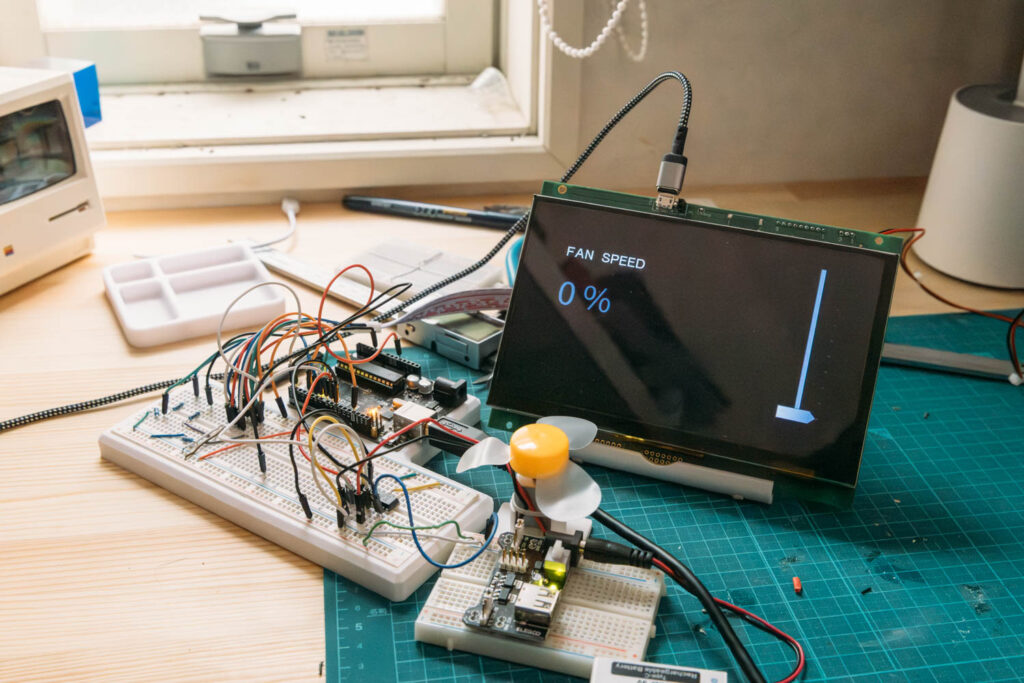
Hardware Configuration and Wiring
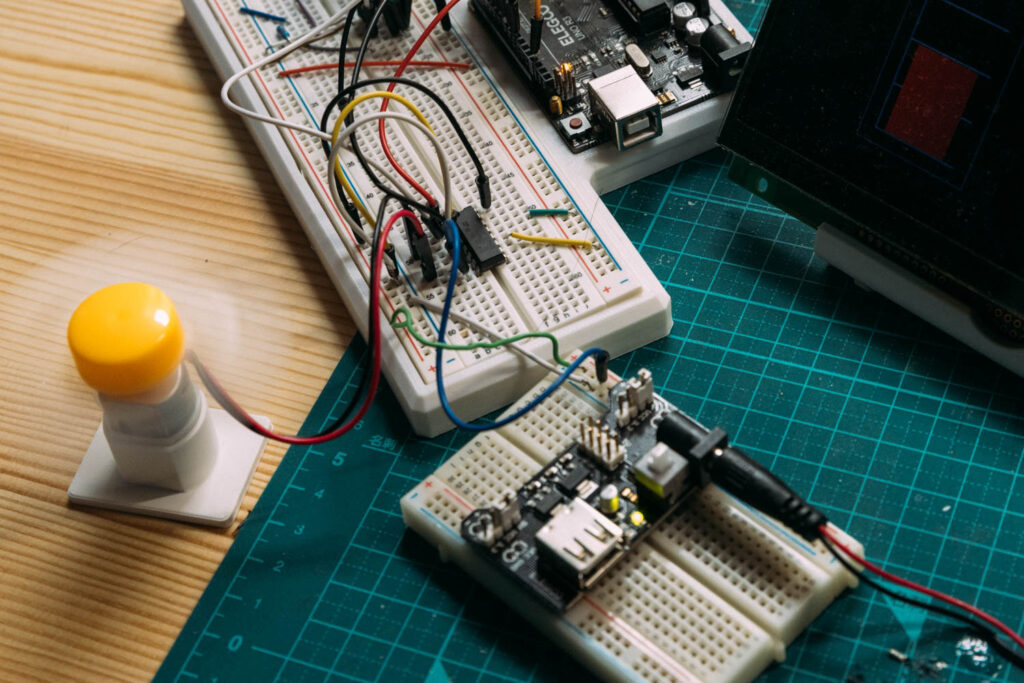
For the physical hardware, we will use a DC motor, a motor driver (L293D), and an external power supply module.
Since the output from the Arduino pins alone does not provide enough power to drive the motor, we need to clearly separate their roles. The Arduino will only send weak power and control signals to the motor driver, while the actual strong power required to rotate the motor will be supplied from the external power supply module.
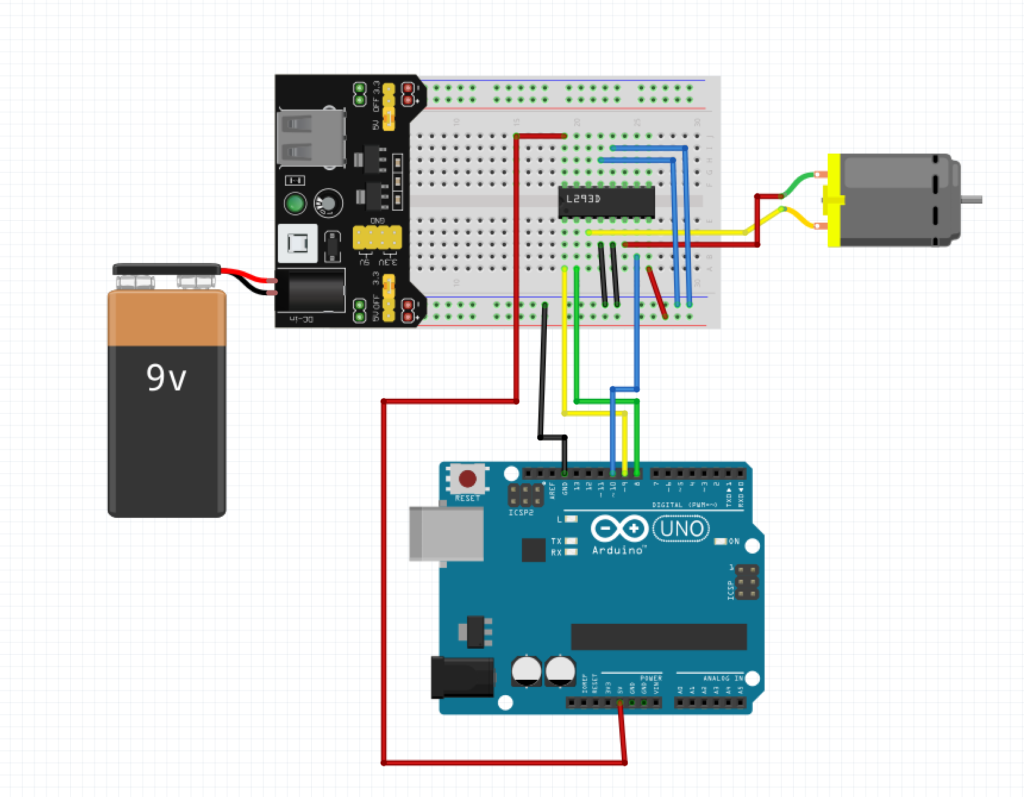
Picture by [Fritzing (CC BY-SA)]
The specific wiring procedure is as follows. To prevent electric shocks or short circuits, ensure that the Arduino’s USB cable and the external power supply are disconnected before starting the work.
Setting up the power supply module
Insert the power supply module into the breadboard and set the output jumper pins to the 5V side.
Placement of the motor driver (L293D), insert the L293D chip across the center groove of the breadboard. Ensure the side with the semicircular notch faces upward.
Concerning the Power and Ground (GND) wiring, when using separate control and drive power supplies, we will share the GND (the system’s baseline). This is the most crucial point.
- Connect pin 16 of the L293D to the Arduino’s 5V pin. (Control power)
- Connect pin 8 of the L293D to the positive side of the power supply module. (Drive power)
- Connect pins 4, 5, 12, and 13 of the L293D all to the negative side of the breadboard.
- Connect the Arduino’s GND pin to the negative side of the breadboard to make the overall GND common.
Wire the control signal lines by connecting the lines that transmit instructions from the Arduino to the DC motor.
- Connect the Arduino’s pin 9 to the L293D’s pin 1. (Speed adjustment)
- Connect the Arduino’s pin 8 to the L293D’s pin 2. (Rotation direction)
- Connect the Arduino’s pin 10 to the L293D’s pin 7. (Rotation direction)
DC motor connection. Finally, connect the two wires from the DC motor to pins 3 and 6 of the L293D, respectively.
By properly separating the power supply systems in this way, you can drive the DC motor stably without putting excessive load on the Arduino.
Arduino Program
We will create a program to link the operations on the GT-SP with the movement of the DC motor. The main processing steps are as follows:
- Read the GT-SP slider value (0–100) and convert it to the DC motor’s rotation speed for control.
- Update the slider value on the screen.
- Send a command to change the text color of the text object based on the numerical range.
- Send the latest value every 1 second to update the BLOCK STACK graph.
- Send a command to change the graph color based on the numerical range.
DownloadDownload sample project & program (for GT Design Studio & Arduino)
|
1 2 3 4 5 6 7 8 9 10 11 12 13 14 15 16 17 18 19 20 21 22 23 24 25 26 27 28 29 30 31 32 33 34 35 36 37 38 39 40 41 42 43 44 45 46 47 48 49 50 51 52 53 54 55 56 57 58 59 60 61 62 63 64 65 66 67 68 69 70 71 72 73 74 75 76 77 78 79 80 81 82 83 84 85 86 87 88 89 90 91 92 93 94 95 96 97 98 99 100 101 102 103 104 105 106 107 108 109 110 111 112 113 114 115 116 117 118 119 120 121 122 123 124 125 126 127 128 129 130 131 132 133 134 135 136 137 138 139 140 141 142 143 144 145 146 147 148 149 150 151 152 153 154 155 156 157 158 159 160 161 162 163 164 165 166 167 168 169 170 171 172 173 174 175 176 177 |
#include <Arduino.h> #include <string.h> // ピン接続 | Pin assign #define GT_DTR 4 // DTR #define GT_DSR 6 // DSR // モーター用ピン設定 | Motor pin settings const int speedPin = 9; const int dir1Pin = 8; const int dir2Pin = 10; // 変数 | Variable unsigned long previousMillis = 0; int currentSliderValue = 0; // 1秒おきのグラフ更新のために数値を記憶しておく変数 | Variable to store the value for the 1-second graph update void setup() { // ピン初期設定 | Pin setting pinMode(GT_DTR, INPUT); pinMode(GT_DSR, OUTPUT); digitalWrite(GT_DSR, LOW); // シリアル通信の開始 | Start serial communication Serial.begin(38400); Serial.setTimeout(100); // モーターピンの初期化 | Initialize motor pins pinMode(speedPin, OUTPUT); pinMode(dir1Pin, OUTPUT); pinMode(dir2Pin, OUTPUT); // 初期状態は前進方向で停止 | Initial state: Stopped in forward direction digitalWrite(dir1Pin, HIGH); digitalWrite(dir2Pin, LOW); analogWrite(speedPin, 0); delay(1000); // 初期化待ち | Wait for initialization } void loop() { unsigned long currentMillis = millis(); // 現在時刻の取得 | Get current time // GT-SPデータ受信 | Receive one GT-SP response data if (Serial.available()) { // GT-SPから数値を取得 | Get numeric value from GT-SP unsigned long gtspValue = gtsp_signal_read_numeric(); currentSliderValue = gtspValue; // グラフ用に値を保持しておく | Store the value for the graph // 1. スライダーの数値(0〜100)を読み取り、DCモーターの回転速度に変換して制御する | Read the slider value (0-100) and convert it to DC motor rotation speed int targetSpeed = map(currentSliderValue, 0, 100, 0, 255); analogWrite(speedPin, targetSpeed); // 2. スライダーの数値を更新する (テキストオブジェクトID:3にパーセント表示を送信) | Update the slider value (Send percentage display to Text Object ID: 3) gtsp_ObjPrpSet_string(3, 0x40, String(currentSliderValue) + " %"); // 3. 数値の範囲に応じて、テキストオブジェクトの文字色を変更するコマンドを送信する | Send a command to change the text color according to the value range unsigned long colorCode; if (currentSliderValue == 0) { colorCode = 0x00808080; // 閾値: 0 の場合は灰色 | Threshold: 0 (Gray) } else if (currentSliderValue <= 50) { colorCode = 0x0000FF00; // 閾値: 1から50 の場合は緑色 | Threshold: 1-50 (Green) } else if (currentSliderValue <= 80) { colorCode = 0x00FFFF00; // 閾値: 51から80 の場合は黄色 | Threshold: 51-80 (Yellow) } else { colorCode = 0x00FF0000; // 閾値: 81から100 の場合は赤色 | Threshold: 81-100 (Red) } // 文字色プロパティ(0x50)にカラーコードを送信 | Send color code to font color property (0x50) gtsp_ObjPrpSet_val(3, 0x50, 4, colorCode); } // 1秒おきにグラフの描画と色変更を行う処理 | Process to draw the graph and change color every 1 second if (currentMillis - previousMillis >= 1000) { // 4. 1秒ごとに最新の数値を送信し、BLOCK STACKグラフを更新する | Send the latest value every second to update the BLOCK STACK graph gtsp_ObjPrpSet_val(0, 0x40, 4, currentSliderValue); // 5. 数値の範囲に応じて、グラフの色を変更するコマンドを送信する | Send a command to change the graph color according to the value range unsigned long graphColorCode; if (currentSliderValue == 0) { graphColorCode = 0x00808080; // 閾値: 0 の場合は灰色 | Threshold: 0 (Gray) } else if (currentSliderValue <= 50) { graphColorCode = 0x0000FF00; // 閾値: 1から50 の場合は緑色 | Threshold: 1-50 (Green) } else if (currentSliderValue <= 80) { graphColorCode = 0x00FFFF00; // 閾値: 51から80 の場合は黄色 | Threshold: 51-80 (Yellow) } else { graphColorCode = 0x00FF0000; // 閾値: 81から100 の場合は赤色 | Threshold: 81-100 (Red) } // グラフオブジェクト(ID:0)のレーンカラープロパティに色を送信 | Send color code to the lane color property of Graph Object (ID: 0) gtsp_ObjPrpSet_val(0, 0x70, 4, graphColorCode); previousMillis = currentMillis; // 時間をリセット | Reset the timer } } /********************** GT-SP関数 | Function for GT-SP **********************/ //////////////////////////////////////////////////// // データ受信(数値用) | Receive data from GT-SP (for Numeric) //////////////////////////////////////////////////// unsigned long gtsp_signal_read_numeric() { byte res_dl[4] = ""; unsigned long dl; if (Serial.find("RESb", 4)) { Serial.readBytes(res_dl, 4); //データ長抽出 | Read data length dl = (unsigned long)(res_dl[0] + (res_dl[1] << 8) + (res_dl[2] << 16) + (res_dl[3] << 24)); //データ長変換 | Convert data length // 数値を受信するためのバッファ | Buffer for receiving numeric values byte res_data_buffer[4]; // データを読み取り | Read data Serial.readBytes(res_data_buffer, dl); // 数値に変換してリターン | Convert to numeric value and return return (unsigned long)(res_data_buffer[0] + (res_data_buffer[1] << 8) + (res_data_buffer[2] << 16) + (res_data_buffer[3] << 24)); } // エラー時は0を返す | Return 0 if error occurs return 0; } //////////////////////////////////////////////////// // オブジェクト制御コマンド - プロパティ設定 (数値用) | Object Control Command - Property Setting (for Value) //////////////////////////////////////////////////// void gtsp_ObjPrpSet_val(int obj, int prp, int ln, unsigned long val) { gt_print("CMD"); // コマンドヘッダ | Command header gt_put(0xd3); // オブジェクト-プロパティ設定コマンド | Object-Property Setting command gt_put(obj >> 0); // オブジェクトNo. 下位バイト | Object No. Lower byte gt_put(obj >> 8); // オブジェクトNo. 上位バイト | Object No. Upper byte gt_put(prp >> 0); // プロパティNo. 下位バイト | Property No. Lower byte gt_put(prp >> 8); // プロパティNo. 上位バイト | Property No. Upper byte gt_put(ln >> 0); // データ長 最下位バイト | Data length Least significant byte gt_put(ln >> 8); // データ長 下位バイト | Data length second byte gt_put(ln >> 16); // データ長 上位バイト | Data length third byte gt_put(ln >> 24); // データ長 最上位バイト | Data length Most significant byte if (ln >= 1) gt_put(val >> 0); if (ln >= 2) gt_put(val >> 8); if (ln >= 3) gt_put(val >> 16); if (ln >= 4) gt_put(val >> 24); } //////////////////////////////////////////////////// // オブジェクト制御コマンド - プロパティ設定 (文字列用) | Object Control Command - Property Setting (for String) //////////////////////////////////////////////////// void gtsp_ObjPrpSet_string(int obj, int prp, String val ) { gt_print("CMD"); //コマンドヘッダ | Command header gt_put(0xd3); //オブジェクト-プロパティ設定コマンド | Object-Property Setting command gt_put(obj >> 0); //オブジェクトNo. 下位バイト | Object No. Lower byte gt_put(obj >> 8); //オブジェクトNo. 上位バイト| Object No. Upper byte gt_put(prp >> 0); //プロパティNo. 下位バイト | Property No. Lower byte gt_put(prp >> 8); //プロパティNo. 上位バイト| Property No. Upper byte gt_put(val.length() >> 0); //データ長 最下位バイト | Data length Least significant byte gt_put(val.length() >> 8); //データ長 下位バイト | Data length second byte gt_put(val.length() >> 16); //データ長 上位バイト | Data length third byte gt_put(val.length() >> 24); //データ長 最上位バイト| Data length Most significant byte gt_print(val); //文字列送信 | Send string } //////////////////////////////////////////////////// // 1byte送信 | Send byte to GT-SP //////////////////////////////////////////////////// void gt_put(unsigned char onebyte) { while (digitalRead(GT_DTR) == HIGH) {} // ビジーチェック | Busy check Serial.write(onebyte); } //////////////////////////////////////////////////// // 文字列送信 | Send String to GT-SP //////////////////////////////////////////////////// void gt_print(String val) { int val_i; // 文字列を1文字ずつ送信 | Send string per one byte for (val_i = 0; val_i < val.length(); val_i++) { while (digitalRead(GT_DTR) == HIGH) {} // ビジーチェック | Busy check Serial.print(val.substring(val_i, val_i + 1)); } } |
Summary
In this article, we introduced how to control a DC motor using multiple objects, such as a slider, a graph, and text. By combining the basic operations we’ve accumulated so far, it’s possible to realize practical interfaces and hardware integration.