Series: Using the GT-SP Touch Panel TFT Display with Arduino
Displaying Real-Time Graphs from Temperature Sensor Data
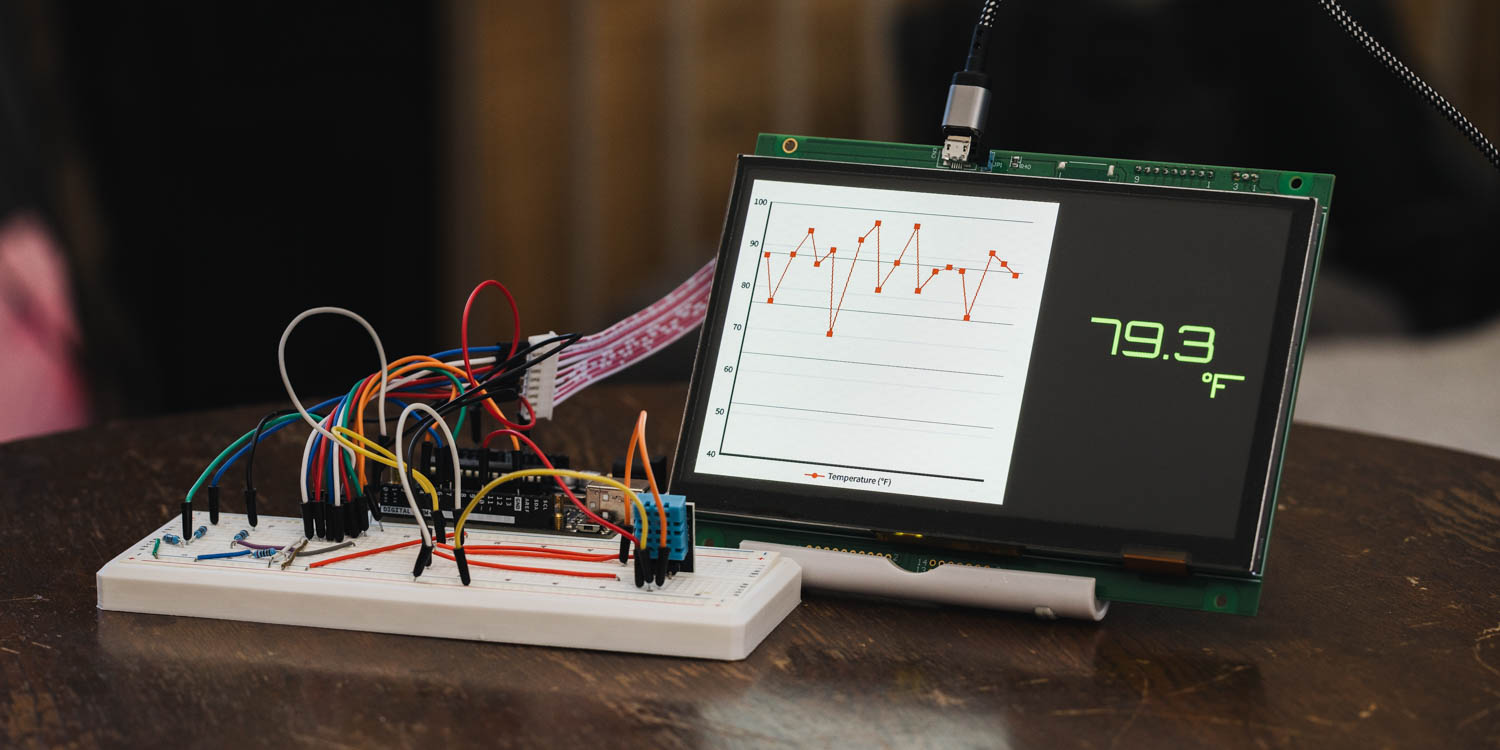
Table of Contents
DownloadDownload sample project & program (for GT Design Studio & Arduino)
Hello everyone, I’m @kissaten, a beginner in electronics. In this series, I’m explaining the process of connecting a 7-inch touch display (GT-SP series “GTWV070S3A00P”) to an Arduino and working on various projects.
In this article, we will read temperature values from a DHT11 sensor at fixed intervals and plot them sequentially on a line graph using the GT-SP display. When the graph reaches 20 data points, the oldest data shifts to the left. The latest temperature value will also be displayed using a text object on the right side.
This time, the received sensor data will be shown as a graph on the left and as a numeric value on the right.
Graph Settings
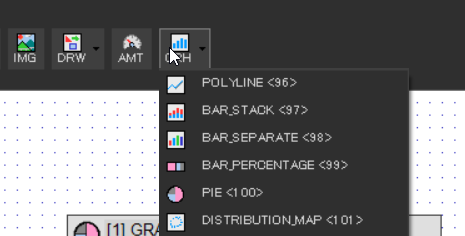
First, place a Graph Object. We will use a polyline graph for this example.
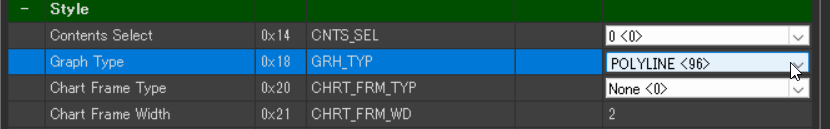
- Style > Graph Type: POLYLINE<96>
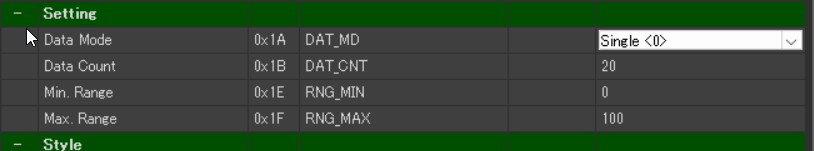
Next, set the number of data points to be displayed.
- Setting > Data Count: 20 (default value)
Define the display range for the graph.
For line graphs, both minimum and maximum values can be set.
- Setting > Min Range: 40
- Setting > Max Range: 100 (default value)
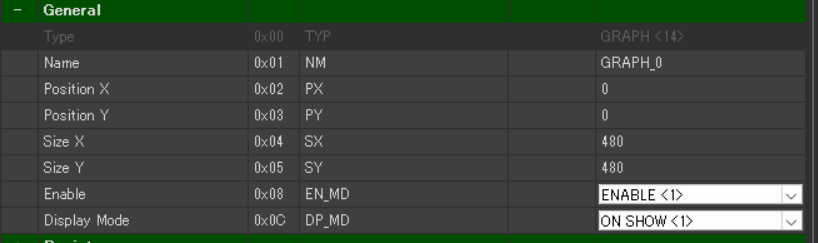
Set the graph position and size.
- General > Position X: 0
- General > Position Y: 0
- General > Size X: 480
- General > Size Y: 480
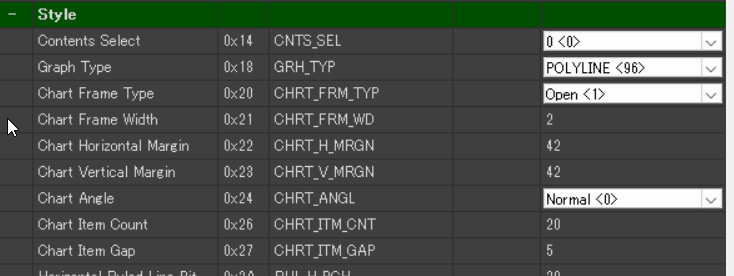
Adjust the graph’s style.
- Style > Chart Frame Type: None
- Style > Chart Horizontal Margin: 42
- Style > Chart Vertical Margin: 42
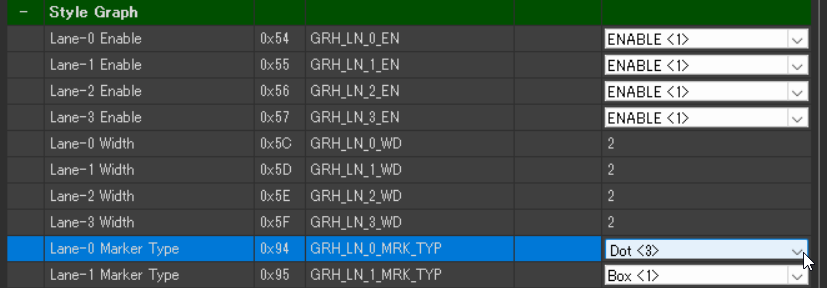
Customize the graph data line style.
- Style Graph > Lane-0 Maker Type: Dot<3>

Set the background image for the graph.
- Image > Background Image0: Select the prepared image from the dialog.
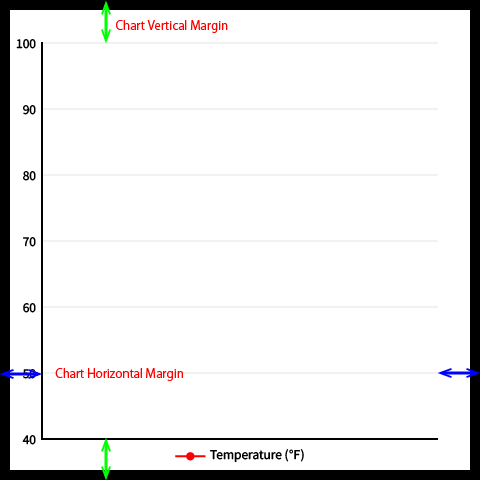
When creating a background image, make sure that the minimum and maximum values and the margins match the settings.
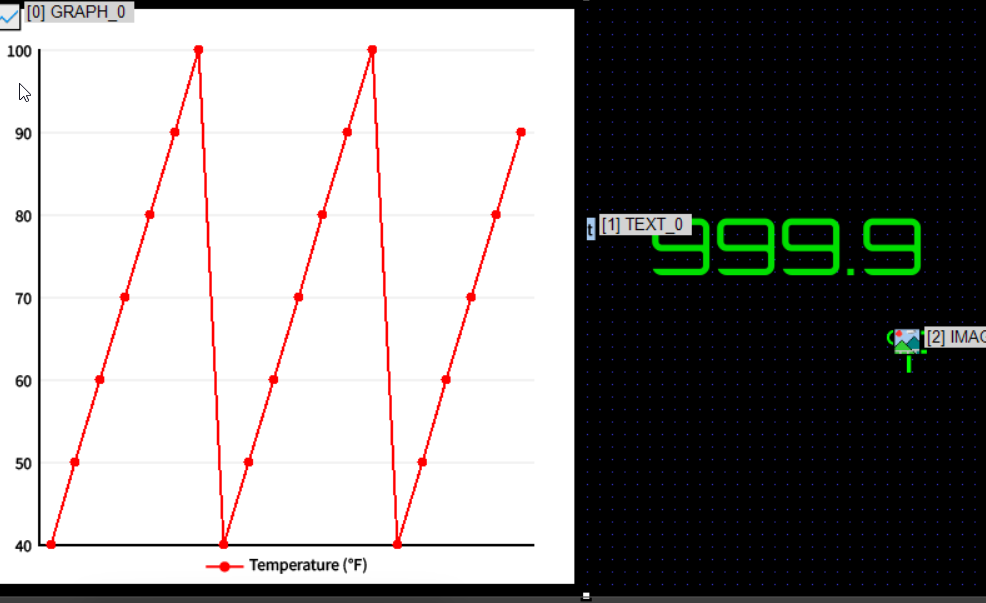
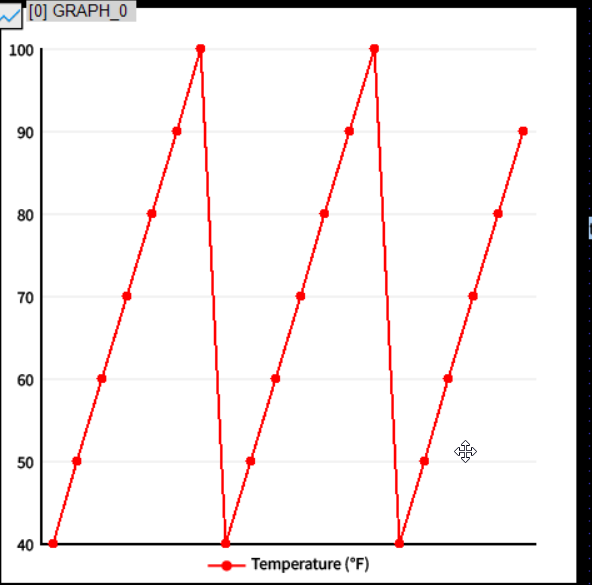
Checking the Graph Display
To preview the appearance, enter test data in Data > Lane-0 Data.
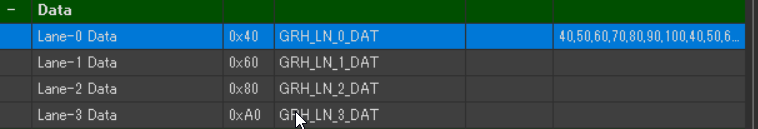
Use comma-separated values. For example:
|
1 |
40,50,60,70,80,90,100,40,50,60,70,80,90,100,40,50,60,70,80,90 |
Text Settings
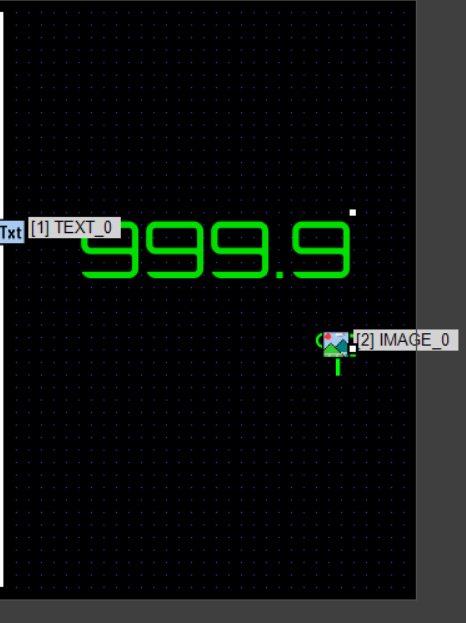
To display the latest temperature, place a Text Object.
-
Enter sample text for layout purposes.
Font Settings
Use the following outline font for text display:
Font: Orbitron https://fonts.google.com/specimen/
For how to set up fonts, refer to the previous article:
Embedding Outline Fonts and Using the Draw Shape Tool
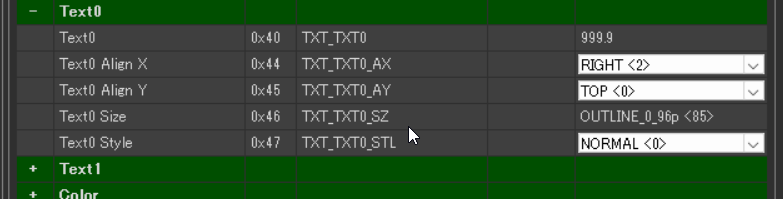
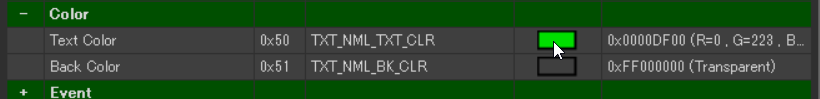
In this example, the font size is 72pt (82) and the color is green (#00DF00).
Displaying Temperature Unit with Image
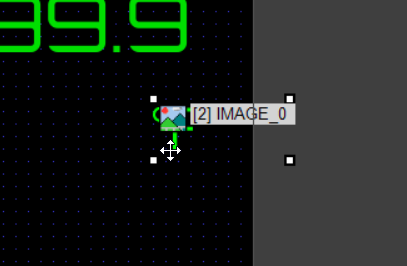
Add an Image Object below the text object to show the temperature unit (°F).
-
Since the Orbitron font doesn’t include the Fahrenheit symbol, we use an image as a substitute.
Overall Page Settings
Set the background color of PAGE_0 to black.

- PAGE_0 > Back Color: #000000
Connecting the DHT11 Sensor
The DHT11 used in this example is a modular type sensor. It has three pins: GND, 5V, and DATA, which should be connected to the Arduino accordingly.
In this setup, the DATA pin is connected to Digital Pin 10 on the Arduino. However, depending on the DHT11 module you have, the pin order may differ, so please check the pin layout before wiring.
The connection between the GT-SP module and the Arduino is omitted here to keep things simple.
If you need detailed wiring information, please refer to the previous articles.
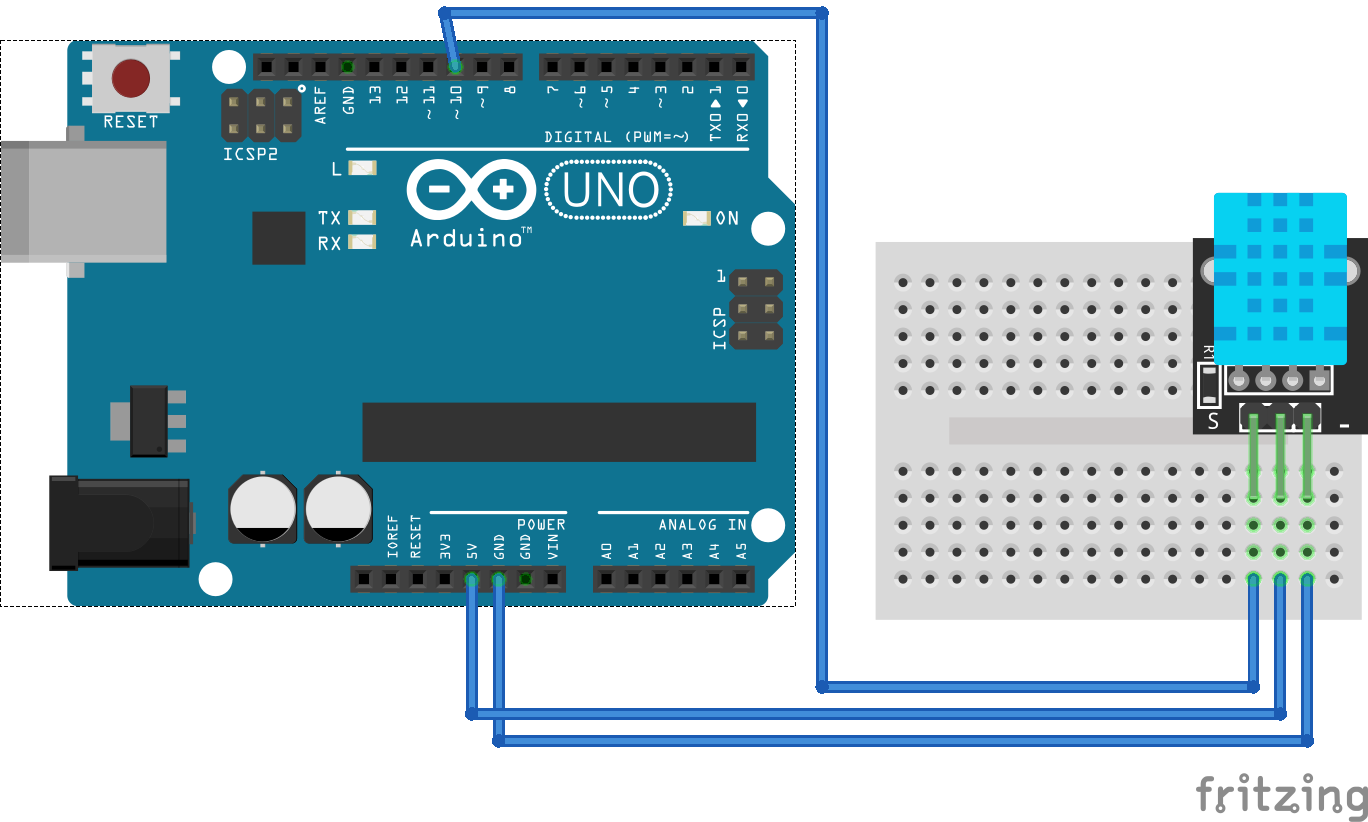
Picture by [Fritzing (CC BY-SA)]
Arduino Program
|
1 2 3 4 5 6 7 8 9 10 11 12 13 14 15 16 17 18 19 20 21 22 23 24 25 26 27 28 29 30 31 32 33 34 35 36 37 38 39 40 41 42 43 44 45 46 47 48 49 50 51 52 53 54 55 56 57 58 59 60 61 62 63 64 65 66 67 68 69 70 71 72 73 74 75 76 77 78 79 80 81 82 83 84 85 86 87 88 89 90 91 92 93 94 95 96 97 98 99 100 101 102 103 104 105 106 107 108 109 110 111 112 113 114 115 116 117 118 119 120 121 122 123 124 125 126 127 128 129 130 131 132 133 134 135 136 |
#include <Arduino.h> #include <string.h> #include "DHT.h" // 追加: DHT温湿度センサー用 | For DHT temperature and humidity sensor // ピン設定 | Pin assignments #define GT_DTR 4 //DTR #define GT_DSR 6 //DSR #define GT_TRDY 7 // TRDY <--未使用 | unused in this sample // 追加: DHT設定(温度のみ使用) | Added: DHT configuration (temperature only) #define DHT_SENSOR_PIN 10 #define DHT_SENSOR_TYPE DHT11 DHT dht(DHT_SENSOR_PIN, DHT_SENSOR_TYPE); // 温度計測間隔設定 | Temperature measurement interval settings unsigned long previousMillis = 0; // グラフ設定 | Graph settings int graphval[20]; int arraysize = 20; // 配列の要素数 | Array size int count = 0; void setup() { pinMode(GT_DTR, INPUT); pinMode(GT_DSR, OUTPUT); pinMode(GT_TRDY, INPUT); Serial.begin(38400); Serial.setTimeout(100); delay(500); // 初期化待ち | Wait for initialization dht.begin(); // DHT初期化 | Initialize DHT sensor // グラフ送信用配列初期化 | Initialize array for sending graph data for (int i = 0; i < arraysize; i++) { graphval[i] = 0x8000; / } } void loop(){ unsigned long currentMillis = millis(); // 現在時刻の取得 | Get current time // 2秒毎に実行する処理 | Execute process every 2 seconds if (currentMillis - previousMillis >= 2000) { float t_raw = dht.readTemperature(true); // 温度データ取得 | Read temperature data // 温度データがあれば処理 | If temperature data is valid, process it if (!isnan(t_raw)) { // 温度データを配列に送信する処理 | Process to send temperature data into the array if (count < arraysize) { // 配列データが全て埋まっていないとき | When the array is not yet full graphval[count++] = t_raw; // 末尾に追加 | Add to the end } else { // 配列データが全て埋まっているとき | When the array is full memmove(&graphval[0], &graphval[1], (arraysize - 1) * sizeof(int)); // 配列データを一つ前にシフト | Shift array data forward by one graphval[arraysize-1] = t_raw; // 末尾に追加 | Add to the end } gtsp_ObjPrpSet_string(1, 0x40, String(t_raw, 1)); //温度配列をグラフに送信 | Send temperature array to the graph gtsp_ObjPrpSet_Graphval(0, 0x40, graphval, arraysize); //温度配列をグラフに送信 | Send temperature array to the graph } previousMillis = currentMillis; // 時間をリセット | Reset the timer } } /********************** GT-SP関数 | Function for GT-SP **********************/ //////////////////////////////////////////////////// // オブジェクト制御コマンド - プロパティ設定 (グラフ値2byte送信用) | Object Control Command - Property Setting (for Graph Value - 2byte) //////////////////////////////////////////////////// void gtsp_ObjPrpSet_Graphval(int obj, int prp, int graphval[], int arraysize) { int val; int ln = arraysize * 2; gt_print("CMD"); // コマンドヘッダ | Command header gt_put(0xd3); // オブジェクト-プロパティ設定コマンド | Object-Property Setting gt_put(obj >> 0); // オブジェクトNo. 下位バイト | Object No. Lower byte gt_put(obj >> 8); // オブジェクトNo. 上位バイト | Object No. Upper byte gt_put(prp >> 0); // プロパティNo. 下位バイト | Property No. Lower byte gt_put(prp >> 8); // プロパティNo. 上位バイト | Property No. Upper byte gt_put(ln >> 0); // データ長 最下位バイト | Data length Least significant byte gt_put(ln >> 8); // データ長 下位バイト | Data length second byte gt_put(ln >> 16); // データ長 上位バイト | Data length third byte gt_put(ln >> 24); // データ長 最上位バイト | Data length Most significant byte for (int i = 0; i < arraysize; i++) { val = graphval[i]; gt_put(val >> 0); gt_put(val >> 8); } } //////////////////////////////////////////////////// // オブジェクト制御コマンド - プロパティ設定 (文字列用) | Object Control Command -Property Setting (for String) //////////////////////////////////////////////////// void gtsp_ObjPrpSet_string(int obj, int prp, String val ) { gt_print("CMD"); //コマンドヘッダ | Command header gt_put(0xd3); //オブジェクト-プロパティ設定コマンド | Object-Property Setting gt_put(obj >> 0); //オブジェクトNo. 下位バイト | Object No. Lower byte gt_put(obj >> 8); //オブジェクトNo. 上位バイト| Object No. Upper byte gt_put(prp >> 0); //プロパティNo. 下位バイト | Property No. Lower byte gt_put(prp >> 8); //プロパティNo. 上位バイト| Property No. Upper byte gt_put(val.length() >> 0); //データ長 最下位バイト | Data length Least significant byte gt_put(val.length() >> 8); //データ長 下位バイト | Data length second byte gt_put(val.length() >> 16); //データ長 上位バイト | Data length third byte gt_put(val.length() >> 24); //データ長 最上位バイト| Data length Most significant byte gt_print(val); //文字列送信 } //////////////////////////////////////////////////// // 1byte送信 | Send byte to GT-SP //////////////////////////////////////////////////// void gt_put(unsigned char onebyte) { while (digitalRead(GT_DTR) == HIGH) {} // busycheck Serial.write(onebyte); } //////////////////////////////////////////////////// // 文字列送信 | Send String to GT-SP //////////////////////////////////////////////////// void gt_print(String val) { int val_i; // 文字列を1文字ずつ送信 | Send string per one byte for (val_i = 0; val_i < val.length(); val_i++) { while (digitalRead(GT_DTR) == HIGH) {} // busycheck Serial.print(val.substring(val_i, val_i + 1)); } } |
DownloadDownload sample project & program (for GT Design Studio & Arduino)
About the Function gtsp_ObjPrpSet_Graphval
In this example, a new function is introduced to send graph data using an array.
-
Unlike previous examples where values were sent as strings, the graph now receives 2-byte numerical data instead.
-
In this article, the graph values are stored in an array and then sent to the GT-SP all at once through the function.
-
When a graph value is set to 0x8000, it will not be plotted on the graph.
This value represents an unused slot. Therefore, when initializing the array, 0x8000 should be assigned to all elements to indicate that they are empty.
Data Acquisition Interval
In this sample, temperature data is read every 2 seconds. You can change the delay() value to adjust the update rate.
Summary
In this example, we displayed real-time temperature data from the DHT11 sensor on the GT-SP series display as both a line graph and a text value. By combining visual and numerical representations, it becomes easier to monitor environmental changes in real time.