Series: Using the GT-SP Touch Panel TFT Display with Arduino
How to Display Data Using GT-SP Graph – Part 4
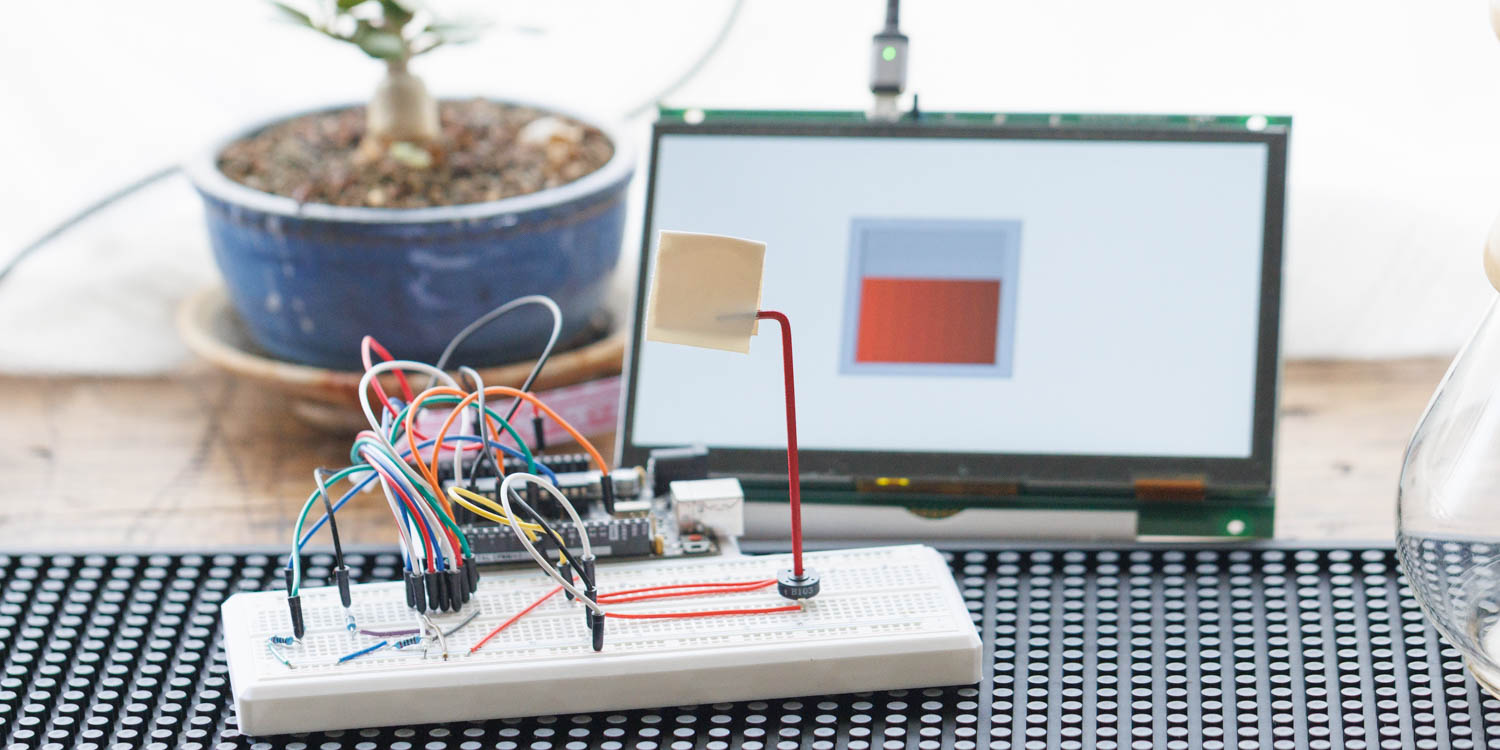
Table of Contents
DownloadDownload sample project & program (for GT Design Studio & Arduino)
Hello everyone, I’m @kissaten, a beginner in electronics. In this series, I’m explaining the process of connecting a 7-inch touch display (GT-SP series “GTWV070S3A00P”) to an Arduino and working on various projects.
In this installment, we’ll use a potentiometer (variable resistor) to change the graph displayed on the GT-SP screen in real-time.
Graph Used in This Project
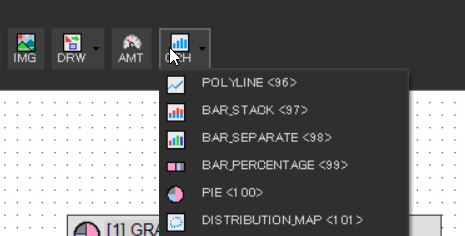
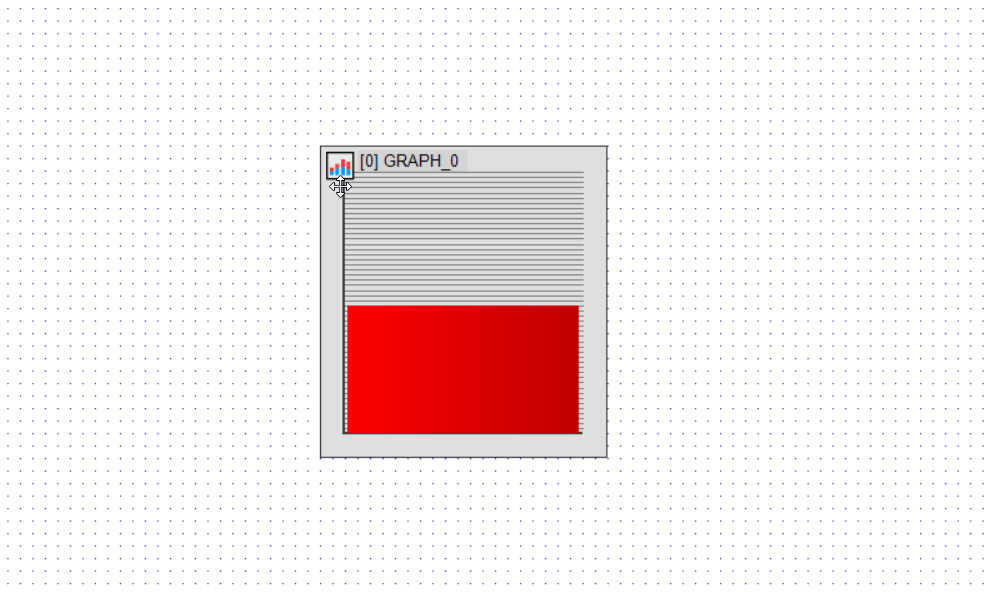
For this project, we’ll use the following graph type:
- BAR_STACK
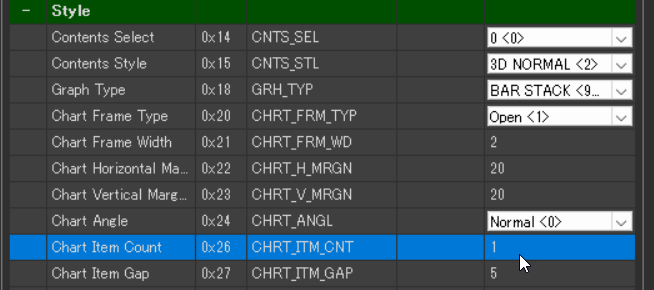
Set Style > Chart Item Count to “1”.
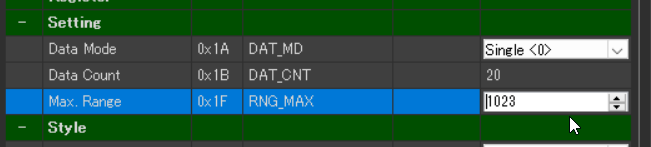
In the Setting tab, set Max. Range to 1023, which matches the upper limit of the potentiometer reading.
In the Setting tab, set Max. Range to 1023, which matches the upper limit of the potentiometer reading.
Connecting the Potentiometer
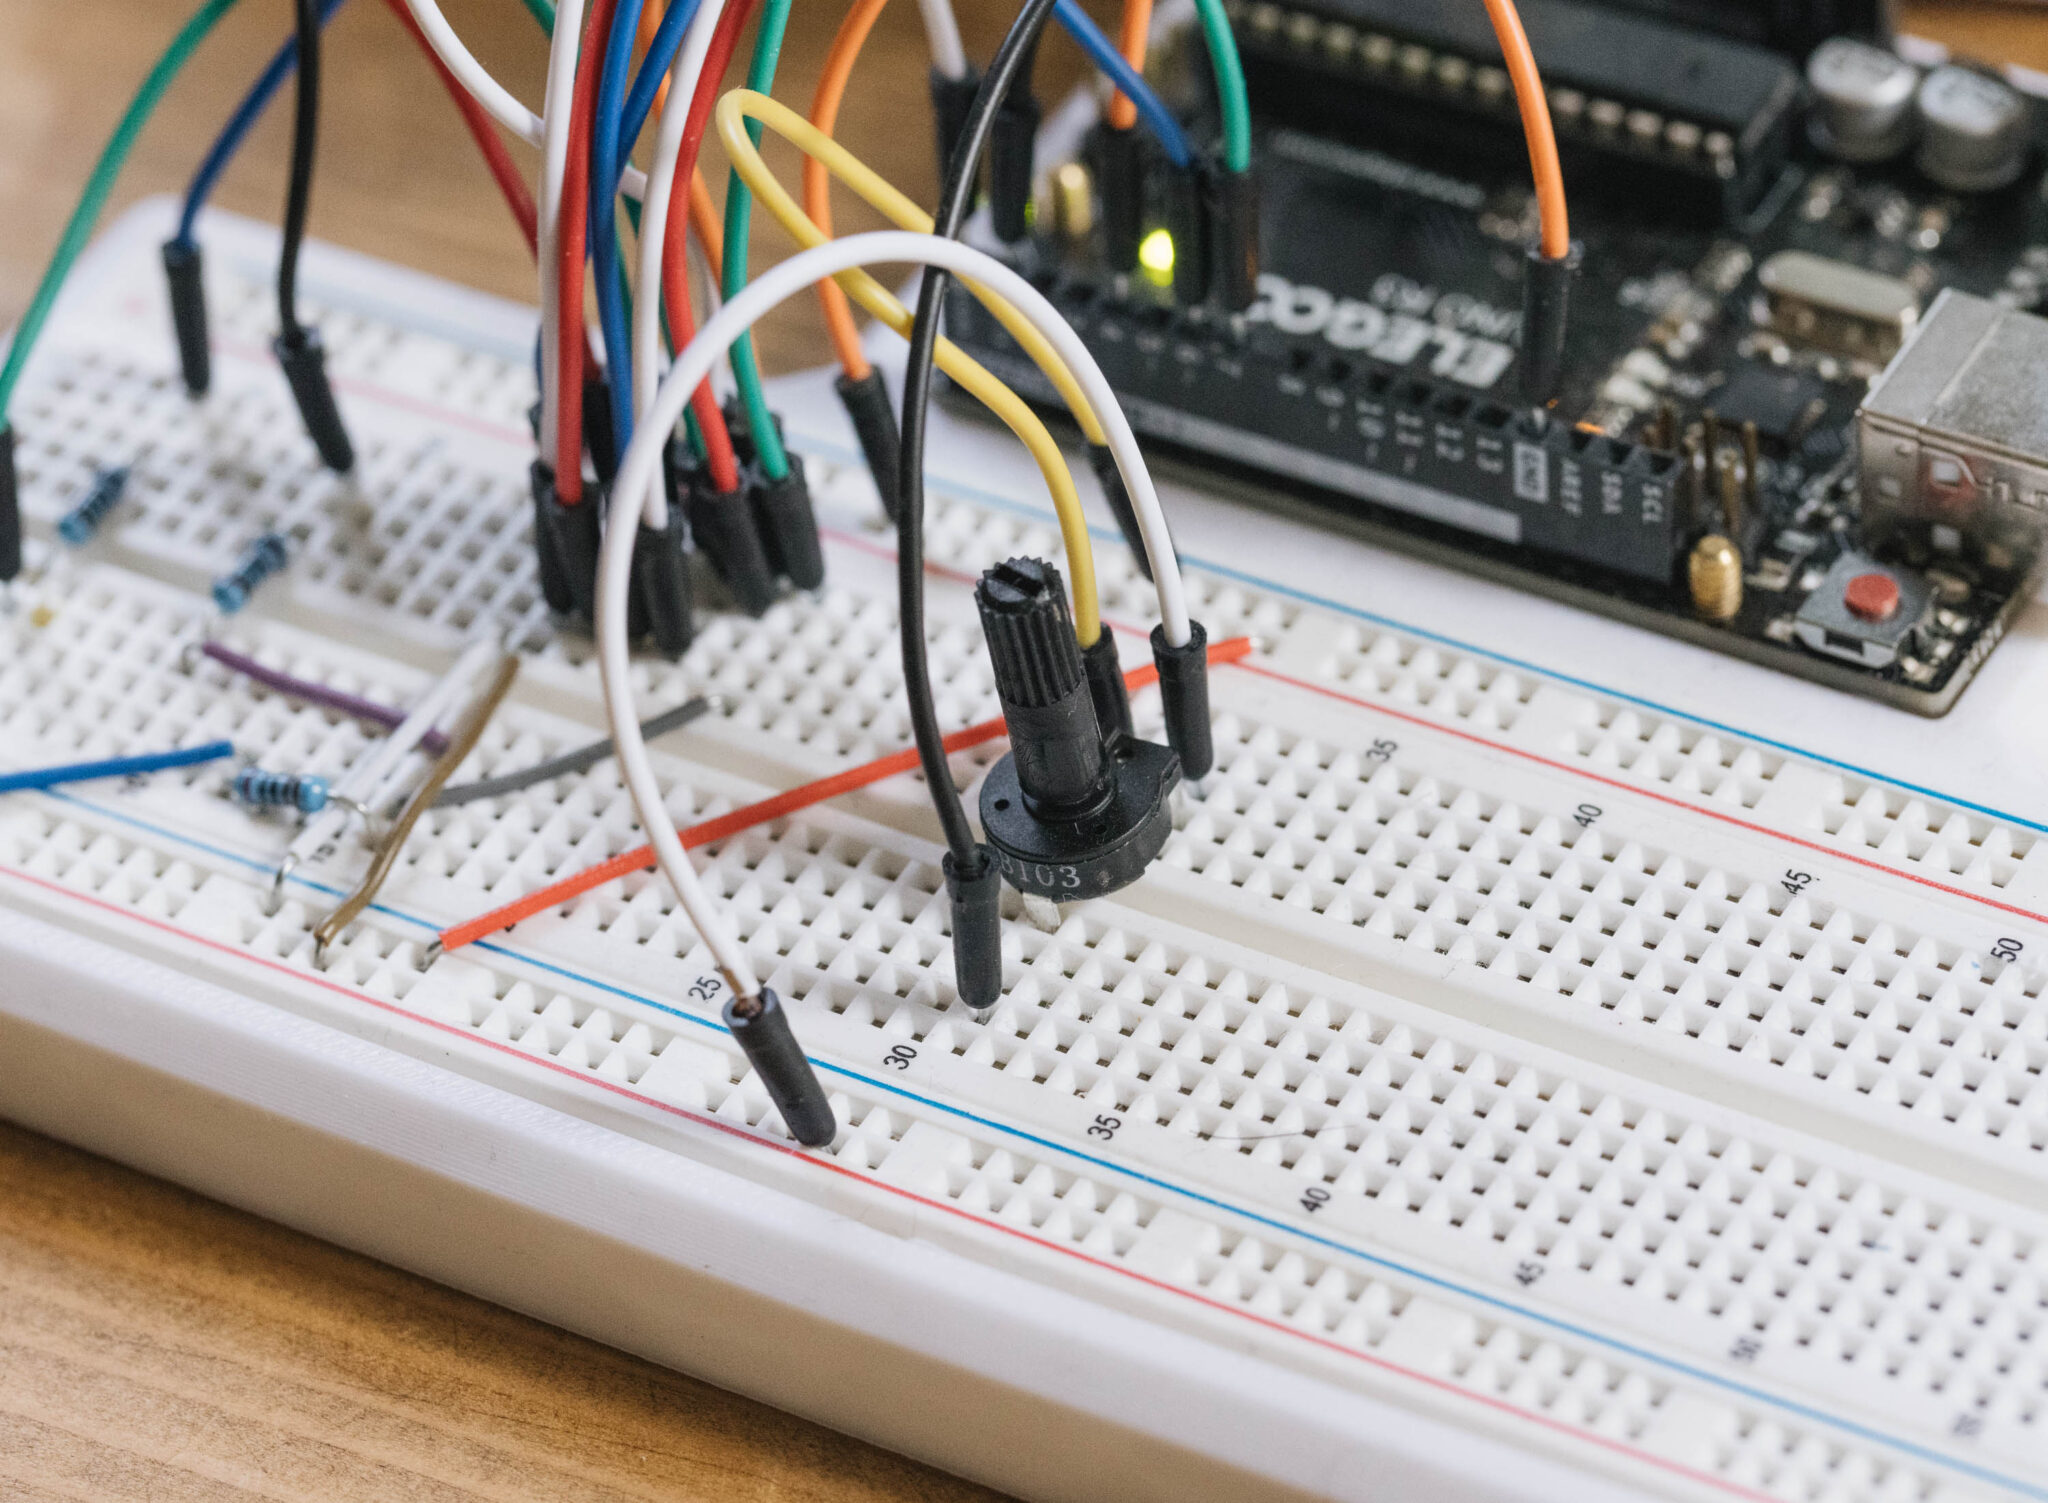
A potentiometer is a type of variable resistor whose resistance changes based on rotation or sliding movement. It allows voltage control and can be used to influence signals in an electronic circuit.
By connecting it to an Arduino, we can easily read analog signals and use those values to control other devices or systems.
In this project, we connected the OUTPUT pin of the potentiometer to A1 on the Arduino.
We also connected the VCC and GND pins appropriately.
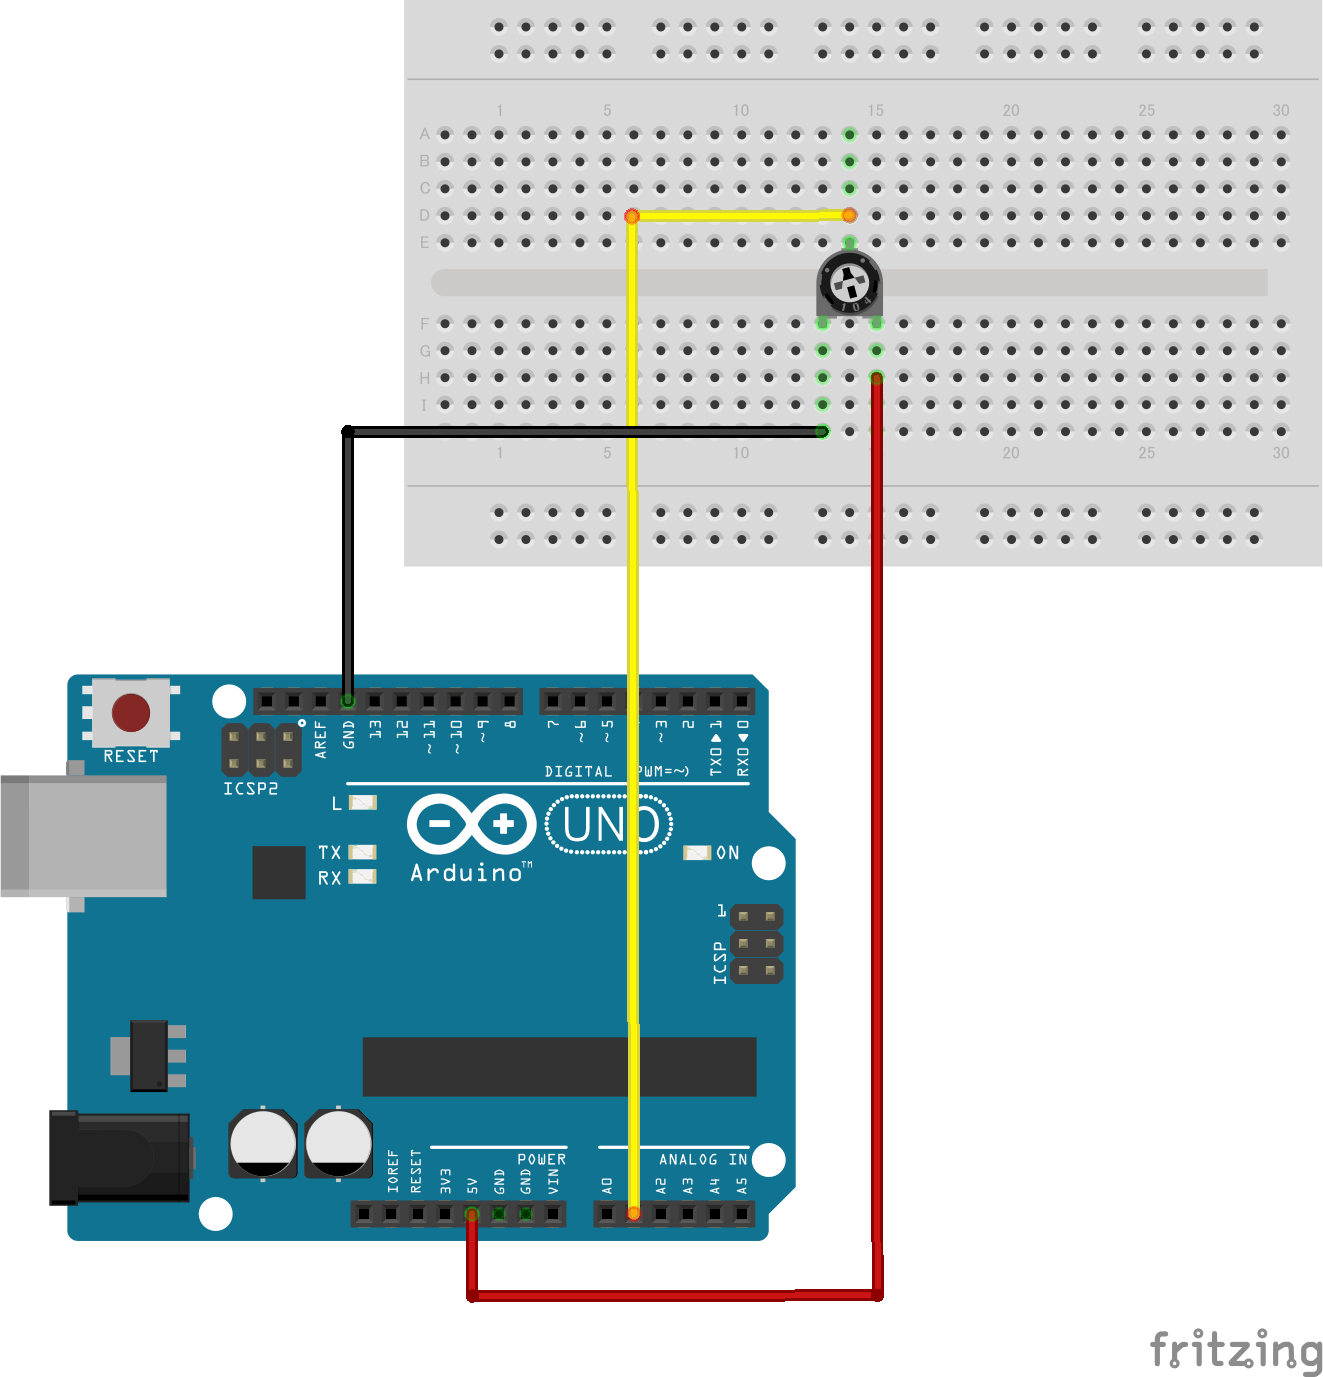
Picture by [Fritzing (CC BY-SA)]
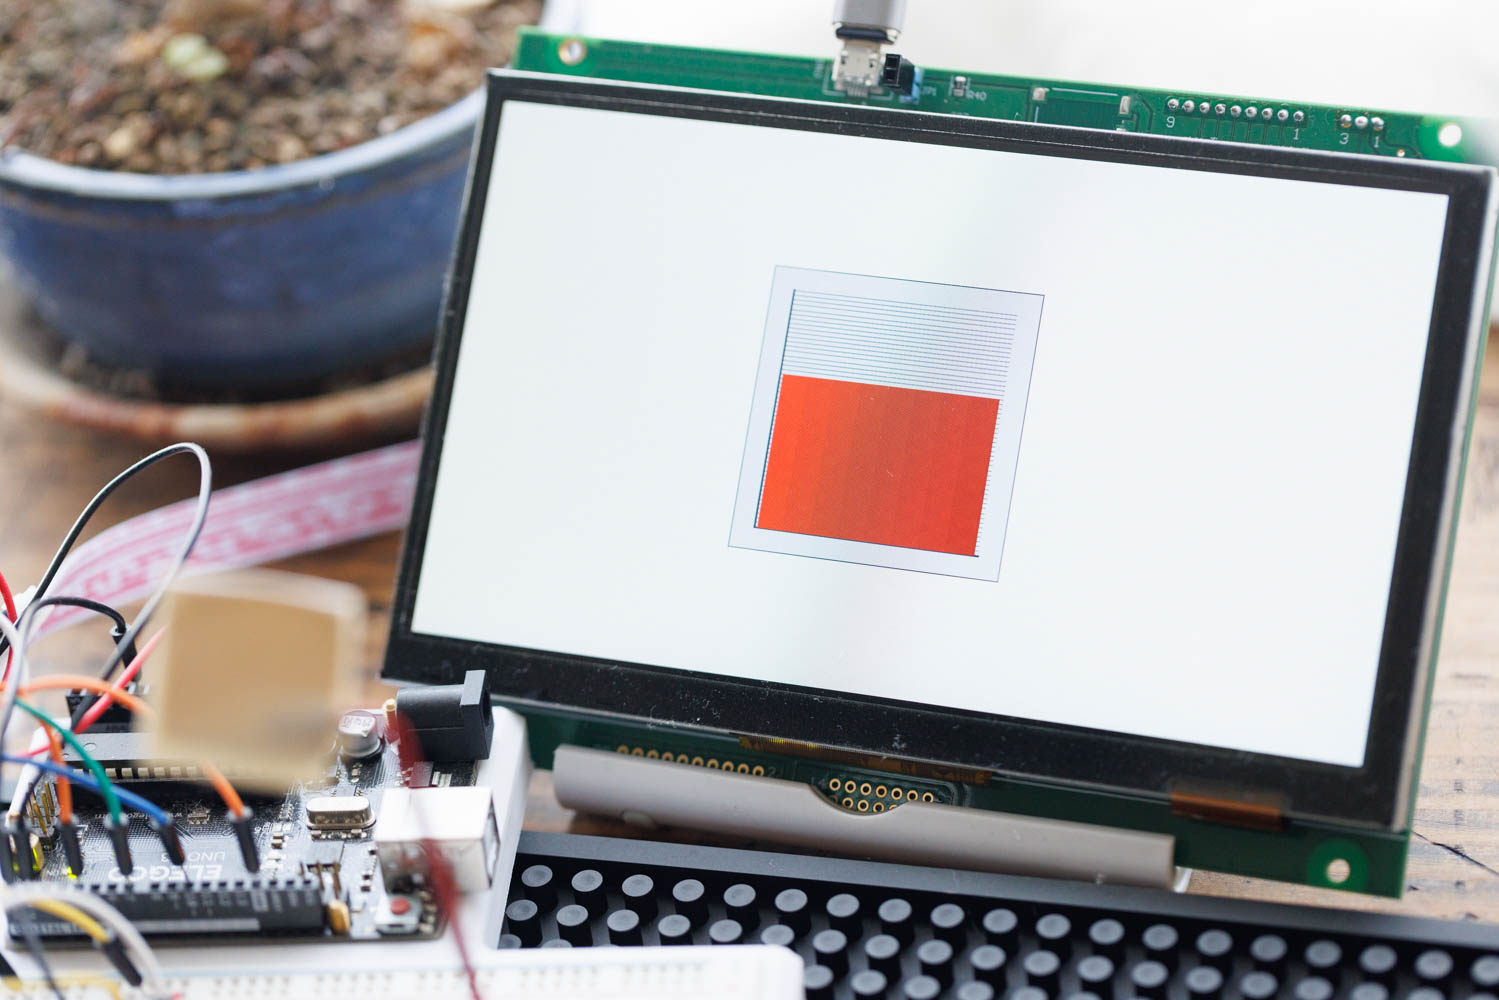
When you rotate the potentiometer, the Arduino reads values between 0 and 1023.
These values are then sent via serial communication to the GT-SP display and visualized as a graph on the screen.
By default, the potentiometer we used increases its value when rotated to the left.
To make the operation more intuitive, we inverted the value in the Arduino code so that the value increases when turned to the right.
Arduino Program
When a potentiometer is connected to pin A1 of the Arduino Uno, you can use analogRead() to get values between 0 and 1023.
We then send those values to the GT-SP display using Serial.print() for communication.
Here’s the actual code:
|
1 2 3 4 5 6 7 8 9 10 11 12 13 14 15 16 17 18 19 20 21 22 23 24 25 26 27 28 29 30 31 32 33 34 35 36 37 38 39 40 41 42 43 44 45 46 47 48 49 50 51 52 53 54 55 56 57 58 59 60 61 62 63 64 65 66 67 68 69 70 71 72 |
#include <string.h> // ピン設定 | Pin assignments #define GT_DTR 4 // DTR #define GT_DSR 6 // DSR #define GT_TRDY 7 // TRDY <--未使用 | unused in this sample void setup() { pinMode(GT_DTR, INPUT); pinMode(GT_DSR, OUTPUT); pinMode(GT_TRDY, INPUT); Serial.begin(38400); Serial.setTimeout(100); delay(1000); // 初期化待ち | Initialization wait } void loop() { // ポテンショメーターの値を読みとる | Read the potentiometer value int sensorValue = analogRead(A1); // 0〜1023 sensorValue = 1023 - sensorValue; // 値を反転する | Invert the value // オブジェクト 0, プロパティ 0x40 に値を送信 | Send value to Object 0, Property 0x40 gtsp_ObjPrpSet_val(0, 0x40, 4, sensorValue); Serial.println(sensorValue); // 値をシリアルモニターに表示 | Display value on Serial Monitor delay(100); // 100ms間隔で更新 | Update every 100ms } /********************** GT-SP関数 | Function for GT-SP **********************/ //////////////////////////////////////////////////// // オブジェクト制御コマンド - プロパティ設定 (数値用) | Object Control Command - Property Setting (for Value) //////////////////////////////////////////////////// void gtsp_ObjPrpSet_val(int obj, int prp, int ln, unsigned long val) { gt_print("CMD"); // コマンドヘッダ | Command header gt_put(0xd3); // オブジェクト-プロパティ設定コマンド | Object-Property Setting gt_put(obj >> 0); // オブジェクトNo. 下位バイト | Object No. Lower byte gt_put(obj >> 8); // オブジェクトNo. 上位バイト | Object No. Upper byte gt_put(prp >> 0); // プロパティNo. 下位バイト | Property No. Lower byte gt_put(prp >> 8); // プロパティNo. 上位バイト | Property No. Upper byte gt_put(ln >> 0); // データ長 最下位バイト | Data length Least significant byte gt_put(ln >> 8); // データ長 下位バイト | Data length second byte gt_put(ln >> 16); // データ長 上位バイト | Data length third byte gt_put(ln >> 24); // データ長 最上位バイト | Data length Most significant byte if (ln >= 1) gt_put(val >> 0); if (ln >= 2) gt_put(val >> 8); if (ln >= 3) gt_put(val >> 16); if (ln >= 4) gt_put(val >> 24); } //////////////////////////////////////////////////// // 1byte送信 | Send byte to GT-SP //////////////////////////////////////////////////// void gt_put(unsigned char onebyte) { while (digitalRead(GT_DTR) == HIGH) {} // busycheck Serial.write(onebyte); } //////////////////////////////////////////////////// // 文字列送信 | Send String to GT-SP //////////////////////////////////////////////////// void gt_print(String val) { int val_i; // 文字列を1文字ずつ送信 | Send string per one byte for (val_i = 0; val_i < val.length(); val_i++) { while (digitalRead(GT_DTR) == HIGH) {} // busycheck Serial.print(val.substring(val_i, val_i + 1)); } } |
DownloadDownload sample project & program (for GT Design Studio & Arduino)
In this program, analogRead() reads the voltage from the potentiometer.
We use the map() function to convert the value to a percentage (0–100), and then send it to the graph component using gtsp_ObjPrpSet_val().
The 0x40 here must match the component ID assigned to the graph part in GT Design Studio.
By turning the potentiometer, you’ll see the height of the graph change in real time.
Summary
In this project, we created a simple system to visualize potentiometer values in real time using Arduino and the GT-SP display.
In the next article, we’ll use a temperature sensor to create a graph that logs temperature changes over time.