Series: Getting Started with GT-CP
Getting Started with GT-CP | Step 5. Adjust the Touch Sensitivity
- GTOMP's "Touch Level Tool"
- Launching "Touch Level Tool"
- Explanation of each item
- Displaying and recording data values
- View logs with "Touch Level Log Viewer"
Series: Getting Started with GT-CP
- Step 1. Connect Display
- Step 2. Install GTOMP
- Step 3. Display “Hello, World!”
- Step 4. Store and Display a Sample Image
- Step 6. Adjust the Touch Sensitivity for Various Cases
- Step 7. Connecting to a Host Controller
- Step 8. Three control methods for GT-CP
- GTOMP Sample Image Menu : Use Sample Program
- Case Study : Image Gallery Program
- Case Study : Tenkey Program
- Case Study : Image Gallery And Slider Program
GTOMP's "Touch Level Tool"
This internal tool is used to visualize the touch level values read from the module’s touch panel. This allows for easy touch sensitivity analysis and efficient threshold adjustment.
Launching "Touch Level Tool"
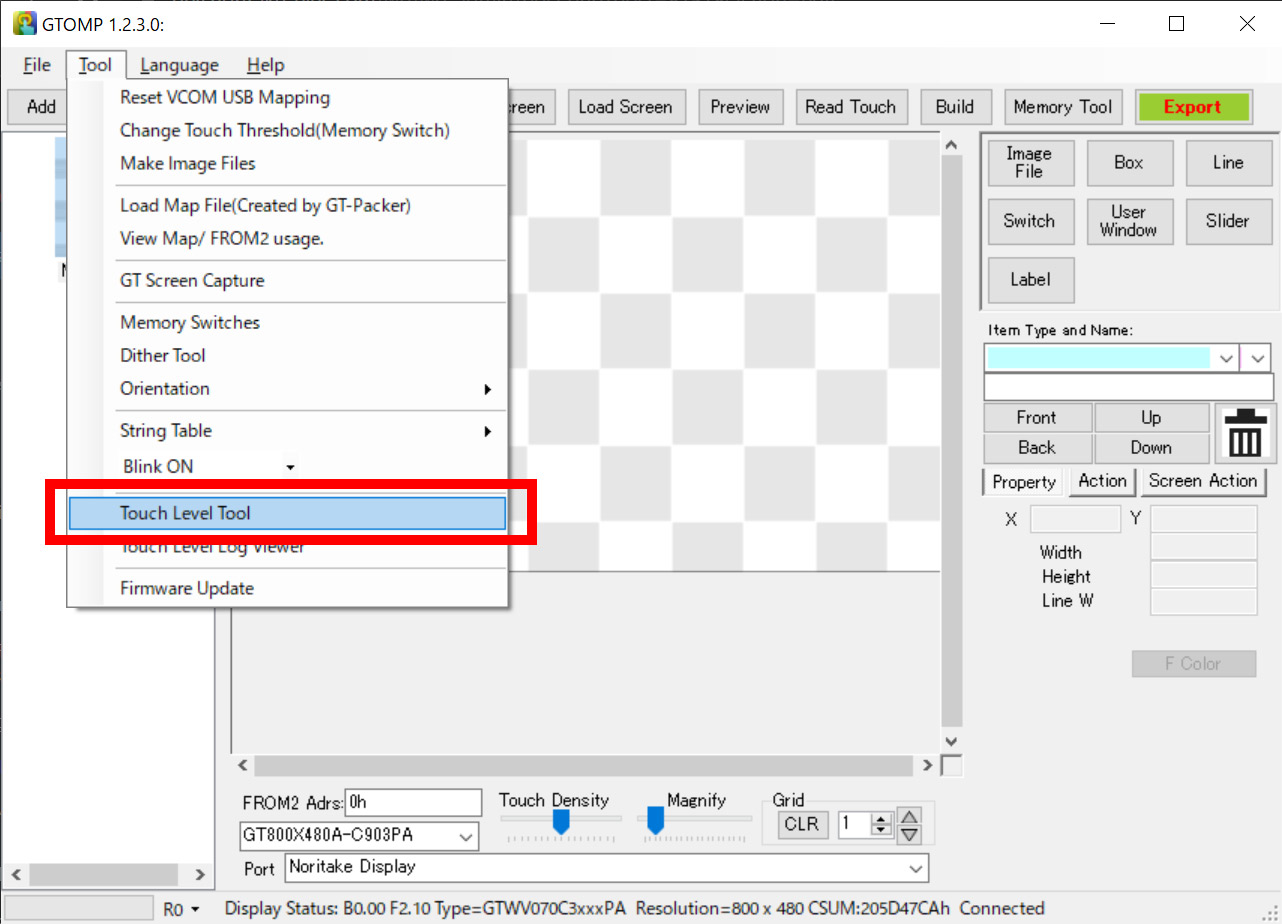
Click GTOMP> Tool> Touch Level Tool open “Touch Level Tool” window.
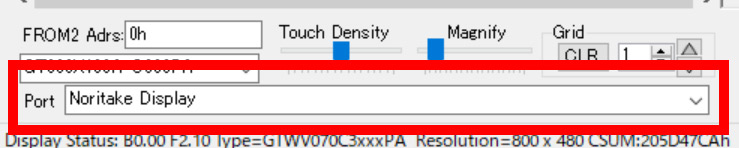
At this time, if the “Touch Level Tool” is grayed out, check the port.
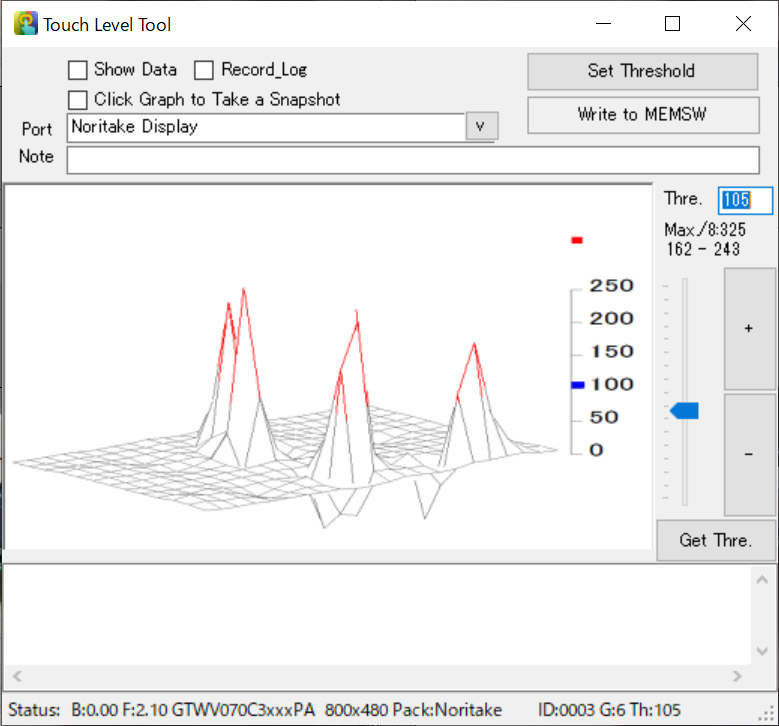
Explanation of each item
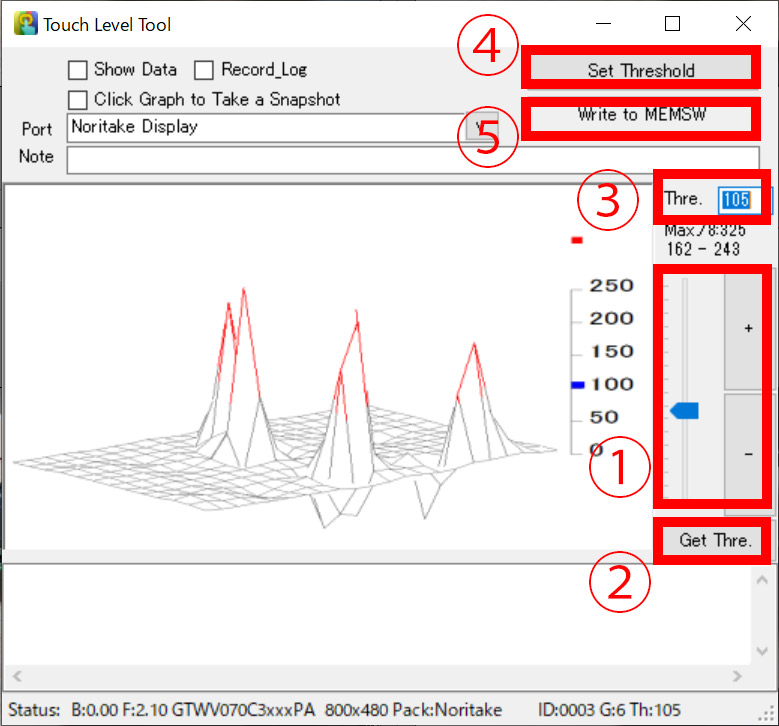
In the window, the scale on the right indicates the converted input touch value (red indicator) related to the touch threshold value (blue indicator).
The red part of the graph is the portion of the touch input that is larger than the threshold value.
The grey part of the graph is the touch data that is lower than the threshold value.
Keep in mind that the graph’s threshold value is not necessarily the active threshold value on the connected module.
- The controls on the right hand side of the window can adjust the module’s threshold value. The “+” and “–” buttons increase and decrease the threshold value by 1. The slider adjusts the graph’s threshold value on a scale from 0 to 255.
- The “Get Thre.” button reads the active threshold value from the connected module and changes the graph’s threshold value. The
- The graph threshold button can also be entered manually in the text box next to the “Thre.” label.
- The “Set Threshold” button will set the graph threshold value as the connected display’s current threshold value.
- The “Write to MEMSW” button will save the current graph threshold value to the connected module’s memory.
Displaying and recording data values
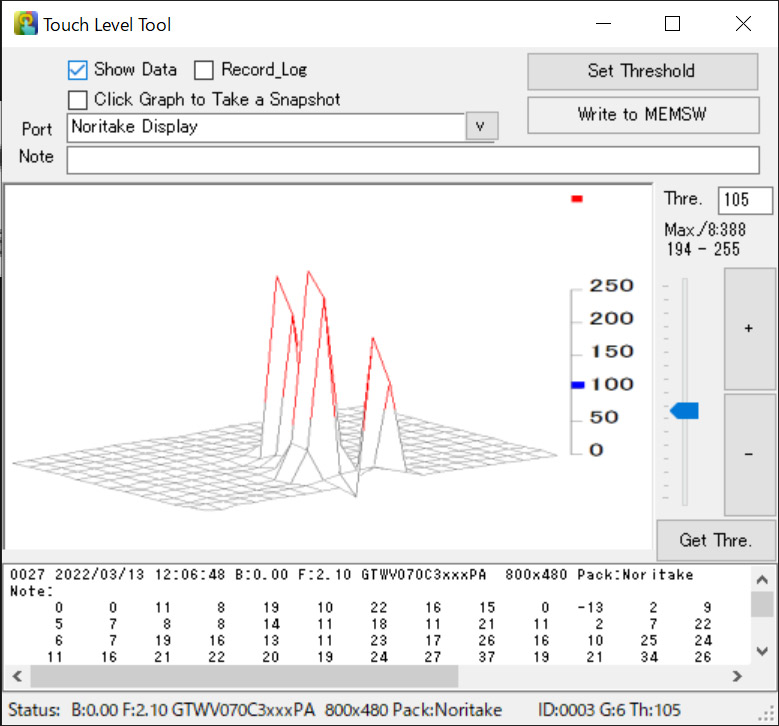
The three checkboxes in the top left corner allow data value viewing and recording.
- Show Data … If the “Show Data” box is checked, the bottom of the window will update with touch count data for each touch electrode.
- Record_Log … If the “Record_Log” box is checked, all future sets of touch data will be recorded and saved in the desired folder. Uncheck the “Record_Log” checkbox to stop recording touch Uncheck the “Record_Log” checkbox to stop recording touch data.
The resulting log file can be opened in the “Touch Level Log Viewer”.
- Click Graph to Take a Snapshot … If the “Click Graph to Take a Snapshot” is check, the tool will take a snapshot of the current touch data if the graph is clicked.
These snapshot files will be saved to the “snapshot” folder in the tool’s install folder (…/GTOMPXXXX/snapshot). Snapshot files can be opened in the ‘Touch Level Log Viewer”.
View logs with "Touch Level Log Viewer"
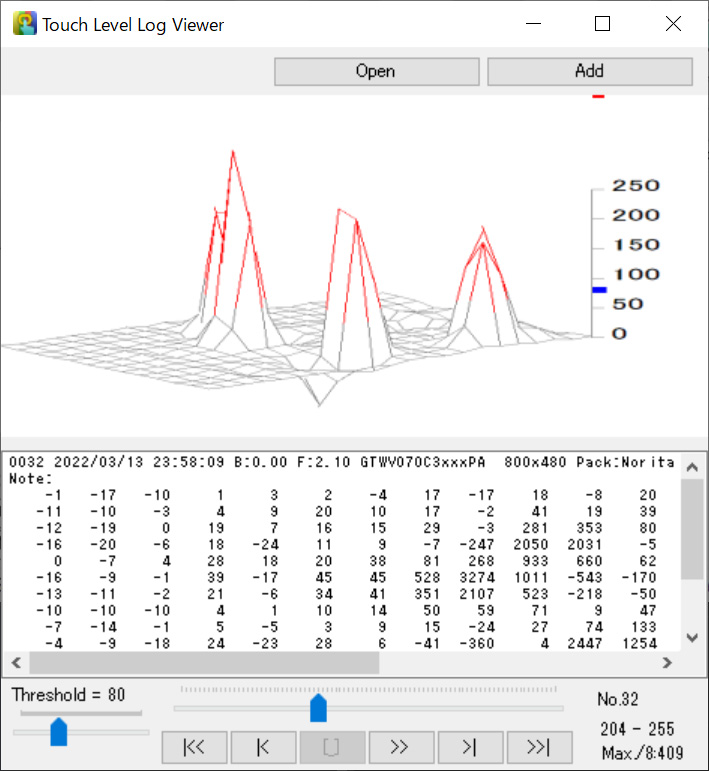
The “Touch Level Log Viewer” can open snapshot and touch log files created by the “Touch Level Tool” .
Click GTOMP> Tool> Touch Level Log Viewer to start Windows of “Touch Level Log Viewer”.
- Open Button … Once opened, the touch data will appear as an array of touch snapshots on the main graph and touch value display.
- Add Button … Can open snapshot and touch log files and will add the touch data to the existing array of touch data snapshots.
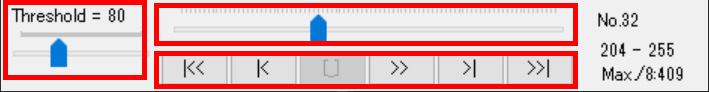
The six buttons at the bottom of the window control the touch snapshots that have been loaded.
- “|<<” will go to the last touch snapshot.
- “|<” will go back by one touch
- “[_]” will stop the automatic walkthrough of all touch
- “>>” will start the automatic walkthrough of all touch
- “>|” will go forward by one touch
- “>>|” will go to the l ast touch snapshot.
The slider directly above the control buttons lets the user scrub through all loaded touch snapshots.
A threshold slider is also present to adjust the snapshot graph’s threshold value.
Operate the small slider on the left to change the red area in the graph.